If you’ve ever clicked on a website and left before it even loaded, you already understand page speed better than most SEO tutorials give you credit for. That instinctive frustration — the one that sends you back to the search results — is exactly what Google has been measuring, studying, and building into its ranking algorithm for over a decade.
Page speed optimization for SEO isn’t a checkbox you tick once and forget. It’s a compounding investment that pays dividends in rankings, user experience, and revenue. This guide breaks it down the way it actually works — technically honest, practically useful, and built on how search engines and real users behave.
What Is Page Speed and Why Does Google Care So Much?
Page speed refers to how quickly a web page loads and becomes usable for a visitor. But that definition barely scratches the surface of what Google actually measures.
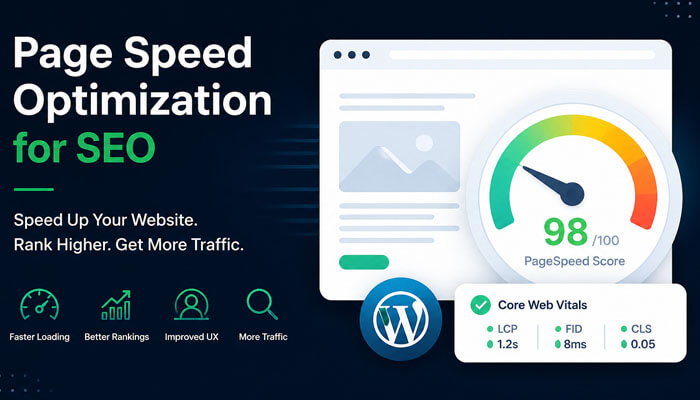
Google doesn’t just care whether your page loaded. It cares when the first thing appeared on screen, when the largest visible element painted, when the page became interactive, and whether the layout jumped around while loading. These nuances come together in what Google calls Core Web Vitals — a set of real-world performance metrics that directly influence search rankings.
The reason Google cares is simple: Google’s business depends on sending users to pages they’re happy with. A slow page makes the user unhappy. An unhappy user blames Google for the bad recommendation. Google, therefore, has a structural incentive to rank fast pages above slow ones — and they’ve made that official policy.
In 2021, Google rolled out the Page Experience update, formally incorporating Core Web Vitals into its ranking signals. In 2024 and beyond, those signals have only grown in importance, especially as Google increasingly relies on real-user data from Chrome to assess page quality.
Core Web Vitals: The Three Metrics That Directly Affect Your Rankings
Understanding Core Web Vitals is non-negotiable if you’re serious about page speed SEO. These three metrics are measured using real user data from Chrome users, which means your lab scores and your field scores can be very different — and Google uses the field data.
1. Largest Contentful Paint (LCP)
LCP measures how long it takes for the largest visible element on the page to render. This is typically a hero image, a large heading, or a video thumbnail. Google’s threshold for a “good” LCP is under 2.5 seconds. Anything between 2.5 and 4 seconds needs improvement. Beyond 4 seconds, Google considers it poor.
LCP is arguably the most directly tied to user perception of speed. When the biggest thing on the page appears, users feel the page has “arrived.”
Common LCP killers:
- Render-blocking resources (JavaScript and CSS that block the browser from painting)
- Slow server response times
- Large, unoptimized images without proper compression or modern formats
- Lazy-loading applied to the LCP element itself (a common but critical mistake)
2. Interaction to Next Paint (INP)
Introduced as a Core Web Vital in March 2024, INP replaced First Input Delay (FID) and measures the responsiveness of a page throughout a user’s entire visit — not just the first interaction. It tracks the latency between any user interaction (click, tap, keypress) and the next visible response on screen.
Good INP is under 200 milliseconds. Poor INP is over 500ms.
Heavy JavaScript execution is the primary culprit for bad INP. Third-party scripts, tag managers, analytics libraries, and ad platforms routinely push INP into the red.
3. Cumulative Layout Shift (CLS)
CLS measures visual stability — how much the page layout unexpectedly shifts while loading. If a button jumps just as you’re about to tap it, that’s a CLS event. Google’s good threshold is a score below 0.1.
CLS is often caused by images without explicit width and height attributes, dynamically injected content (ads, banners, cookie notices), and web fonts that swap out after rendering.
How Page Speed Affects SEO Beyond Rankings
Rankings are the headline story, but page speed touches SEO in subtler ways that compound over time.
Crawl budget. Google allocates a finite crawl budget to each site. Slow pages consume more of that budget per crawl, meaning Google crawls fewer of your pages in any given window. For large sites with thousands of URLs, this can mean important pages going unindexed or getting crawled infrequently.
Bounce rate and dwell time signals. While Google officially doesn’t use bounce rate as a ranking factor, there’s a practical chain reaction: slow pages → higher bounce rates → less time on site → fewer pages indexed with user engagement signals → weakened topical authority signals over time. The indirect effects are real.
Mobile-first indexing. Google has used mobile-first indexing since 2019, meaning it evaluates your mobile page’s speed and experience first. If your desktop site is fast but your mobile site isn’t, your rankings reflect the mobile version.
Conversion and revenue. A 2023 study by Portent found that websites loading in 1 second convert three times better than those loading in 5 seconds. Page speed is a business metric as much as it’s a technical one. Better conversion → lower bounce → stronger engagement signals → better long-term SEO performance.
Diagnosing Your Page Speed Problems: The Right Tools
Before you optimize anything, you need accurate data. Using only one tool gives you a partial picture.
Google PageSpeed Insights — The most important tool for SEO purposes because it uses both lab data (Lighthouse) and field data (Chrome User Experience Report / CrUX). It’s the field data that feeds into Google’s ranking signals. A page with a good lab score but poor field data still has an SEO problem.
Google Search Console (Core Web Vitals report) — Shows your CWV performance aggregated by page group, segmented by mobile and desktop. This is real data from real users on your actual site. If you only look at one report for SEO purposes, make it this one.
Chrome DevTools and Lighthouse — For deep-dive technical diagnostics. The Performance panel’s flame chart shows you exactly where time is being spent during page load — main thread blocking, long tasks, network waterfalls. Essential for developers fixing root causes.
WebPageTest — A free tool (webpagetest.org) that offers more granular waterfall charts, filmstrip view, and the ability to test from multiple global locations. Particularly useful for understanding how your CDN and server location affect load times across geographies.
GTmetrix — Useful for monitoring and historical tracking. Combines Lighthouse data with its own performance scoring and gives you waterfall analysis.
The key discipline: always test on mobile, on a simulated slower connection (3G or 4G), and from the location your users are actually in. Desktop, fiber-connection tests from a data center will almost always look better than what your real users experience.
Technical Page Speed Optimizations: What to Actually Fix
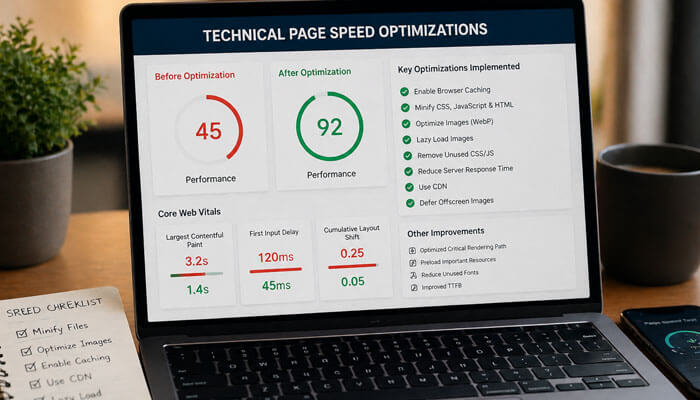
This is where most guides either go too vague (“optimize your images!”) or too granular (“set this specific HTTP header value”). What follows is a structured, priority-ordered breakdown of what matters most.
Server and Hosting Performance
Everything starts here. No amount of frontend optimization compensates for a slow server.
Time to First Byte (TTFB) is the time between a browser requesting your page and receiving the first byte of the response. Google considers under 800ms good. If your TTFB is above 1.5 seconds, frontend optimizations have a ceiling.
Improve TTFB by:
- Upgrading to a hosting tier with dedicated resources (shared hosting is a common TTFB killer)
- Using server-side caching (Redis, Memcached, or full-page caching via your CMS)
- Choosing a hosting provider with servers geographically close to your primary audience
- Using a Content Delivery Network (CDN) to cache and serve static assets from edge nodes near users
HTTP/2 and HTTP/3 should be enabled on your server. HTTP/2 allows multiple requests over a single connection (multiplexing), dramatically reducing the overhead of loading many small files. HTTP/3 goes further with QUIC protocol, which improves performance on unreliable connections. Most modern CDNs and hosting providers support both.
Image Optimization
Images are typically the heaviest assets on any page and the most commonly neglected. A single unoptimized hero image can add 2–4 seconds to LCP alone.
Use modern image formats. WebP delivers roughly 25–35% smaller file sizes than JPEG at equivalent quality. AVIF goes even further — 50% smaller than JPEG in many cases. Always serve WebP with a JPEG/PNG fallback using the HTML <picture> element for browser compatibility.
Set explicit width and height attributes. This one change alone can resolve most CLS issues. When the browser knows the dimensions of an image before it loads, it reserves the space — no layout shift occurs.
Implement lazy loading correctly. Use loading="lazy" on images below the fold, but never on your LCP element. The LCP image should load eagerly and, ideally, be preloaded using <link rel="preload"> in the <head>.
Compress images aggressively. Tools like Squoosh, Sharp (for Node.js pipelines), and Imagify (for WordPress) allow you to find the sweet spot between file size and visual quality. For most web images, quality settings of 75–85% are indistinguishable to users but dramatically smaller in file size.
Use responsive images. The srcset and sizes attributes let the browser choose the appropriately sized image for the device. A mobile user on a 390px-wide screen shouldn’t be downloading a 1920px image.
CSS and JavaScript Optimization
Render-blocking resources are the most common cause of poor LCP scores outside of server performance and images.
Eliminate render-blocking resources. By default, CSS in the <head> blocks rendering entirely — the browser won’t paint anything until it has downloaded and parsed all CSS. JavaScript in the <head> without defer or async does the same. Audit your <head> with PageSpeed Insights and defer or asynchronously load anything non-critical.
Minify CSS, JavaScript, and HTML. Minification removes whitespace, comments, and redundant characters. Tools like Terser (JS), cssnano (CSS), and html-minifier reduce file sizes by 20–40% without changing functionality. Most build tools (Vite, webpack, Parcel) do this automatically in production builds.
Remove unused CSS and JavaScript. This is often the highest-impact optimization for JavaScript-heavy sites. Tools like PurgeCSS scan your HTML and remove CSS rules that are never used. Chrome DevTools’ Coverage tab shows you exactly what percentage of your loaded CSS and JS is actually executed. Code-splitting — breaking JavaScript into smaller chunks loaded only when needed — can dramatically reduce initial payload.
Tree shaking. Modern bundlers eliminate dead code from JavaScript modules during the build process. Ensure your project is configured for tree shaking, particularly if you’re using large libraries where you only use a fraction of the available functions.
Defer non-critical JavaScript. Third-party scripts — analytics, chat widgets, social share buttons, heatmaps — are often the worst INP offenders. Load them after the page’s critical content has rendered. The defer attribute on script tags ensures they execute after HTML parsing. For truly non-critical scripts, loading them on user interaction (first scroll, first click) is even better.
Caching Strategy
Caching is one of the highest-return, lowest-risk optimizations available. It reduces server load, cuts bandwidth, and makes repeat visits dramatically faster.
Browser caching via Cache-Control headers tells browsers to store static assets locally and not re-request them on subsequent page loads. Set long cache lifetimes (1 year) for versioned assets (files with a hash in the filename). For HTML, use short cache times or no-cache to ensure users get fresh content.
CDN caching stores cached versions of your pages at edge nodes globally. When a user requests your page, they get it from a server nearby rather than your origin server. For static sites and blogs, CDN caching alone can cut TTFB by 200–800ms for international visitors.
Service Workers enable offline caching and advanced caching strategies for web apps. They’re more complex to implement but allow extremely fine-grained control over what’s cached and for how long.
Font Optimization
Web fonts are a surprisingly common source of both LCP delays and CLS.
Self-host your fonts. Loading fonts from Google Fonts or Adobe Fonts adds an extra DNS lookup, TCP connection, and HTTP request to an external domain. Self-hosting eliminates this latency entirely and gives you full control over caching headers.
Use font-display: swap or font-display: optional. The swap value tells the browser to show text in a fallback font immediately while the web font loads, then swap it in — preventing invisible text (FOIT) at the cost of a small layout shift. The optional value tells the browser to use the web font only if it loads within a very short window, otherwise stick with the fallback. optional is better for CLS; swap is better for perceived text availability.
Preload critical fonts. Add <link rel="preload" as="font" href="/fonts/your-font.woff2" crossorigin> in your <head> for fonts used on visible text above the fold.
Subset your fonts. A full Latin character set font might include thousands of glyphs you never use. Tools like pyftsubset and Google Fonts’ text= parameter let you download only the characters you need, sometimes cutting font file sizes by 80%.
Third-Party Scripts
Third-party scripts are often the most politically sensitive optimization topic — marketing, sales, and analytics teams have strong opinions about their tools. They’re also frequently the largest contributors to poor INP and high Total Blocking Time.
Audit every third-party script on your site. Ask: does this script need to load on every page? Does it need to load immediately, or can it load after the main content is interactive? Common candidates for deferral or removal:
- Tag managers loading 15+ tags (audit and prune regularly)
- Multiple redundant analytics platforms
- Social sharing widgets that add 100–400ms of loading
- Live chat widgets on pages where chat is rarely used
Use a tag manager with a performance-conscious loading strategy. Google Tag Manager’s “DOM Ready” and “Window Loaded” triggers are significantly better than “All Pages” (which fires immediately on page load) for most marketing tags.
Page Speed Optimization for WordPress
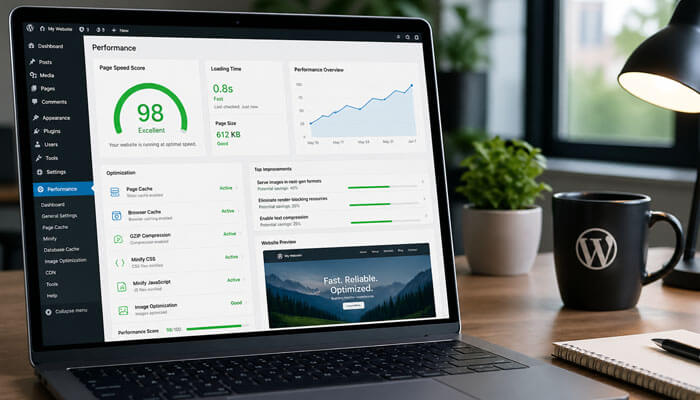
WordPress powers over 40% of the web, and it has specific optimization patterns worth addressing directly.
Caching plugins. WP Rocket, W3 Total Cache, and LiteSpeed Cache generate static HTML files from your dynamic WordPress pages, dramatically reducing server load and TTFB. WP Rocket in particular handles many optimizations automatically (file minification, lazy loading, preloading) with minimal configuration.
Avoid page builders for performance-critical pages. Elementor, Divi, and similar visual builders produce bloated HTML and load extensive CSS/JS on every page, regardless of what’s actually used. If performance is a priority, consider a lightweight theme with hand-coded templates for key landing pages.
Optimize your database. WordPress databases accumulate overhead — post revisions, transients, spam comments, orphaned metadata. Plugins like WP-Optimize clean database tables and improve query times.
Choose your hosting accordingly. Managed WordPress hosting providers (Kinsta, WP Engine, Pressable) are optimized for WordPress’s specific caching and performance needs. They handle server-level caching, CDN integration, and PHP optimization in ways that generic shared hosting doesn’t.
Page Speed and Mobile SEO: A Special Case
Mobile deserves its own section because mobile performance is worse than desktop performance on most sites — and it’s what Google uses for rankings.
Mobile devices have less processing power, meaning JavaScript-heavy pages that run fine on a MacBook Pro create janky, slow experiences on a mid-range Android phone. The simulated “Mobile” test in Lighthouse uses a Moto G4-equivalent device to reflect the median global Android user, not a flagship smartphone.
Test with real devices. Emulation is useful but imperfect. Testing on a physical mid-range Android device over a real 4G connection will show you performance issues that emulation masks.
Avoid intrusive interstitials. Pop-ups and full-screen overlays that appear immediately on mobile pages trigger Google’s “intrusive interstitials” penalty. They also destroy user experience and drive up bounce rates. If you must use them, trigger them on exit intent or after meaningful engagement.
Touch targets need to be large enough. Small buttons and links create both UX problems and CLS events when users miss-tap and the page responds unexpectedly. Google’s guidelines suggest touch targets of at least 48×48 CSS pixels.
Measuring, Monitoring, and Maintaining Performance Over Time
Page speed optimization is not a one-time project. New content, plugins, scripts, and deployments introduce regressions constantly. The sites that maintain fast performance over time do so through systematic monitoring, not heroic one-off efforts.
Set up automated performance monitoring. Tools like SpeedCurve, Calibre, and Treo allow you to monitor CWV metrics over time with alerts when performance degrades. Google Search Console’s Core Web Vitals report also tracks trends over a 90-day window.
Integrate performance testing into your deployment pipeline. Run Lighthouse CI checks on every pull request so performance regressions are caught before they reach production. GitHub Actions, CircleCI, and similar CI/CD platforms support Lighthouse CI out of the box.
Establish a performance budget. A performance budget sets hard limits on metrics like Total Blocking Time, JavaScript bundle size, or LCP. When a change would push a metric over the budget, it triggers a review. This shifts the conversation from reactive (“why is the site slow?”) to proactive (“does this feature fit our performance constraints?”).
Audit third-party scripts quarterly. Third-party vendors frequently update their scripts, sometimes adding significant overhead. Quarterly audits using WebPageTest or Chrome DevTools’ Network panel keep third-party bloat in check.
Common Page Speed Myths Worth Debunking
“A higher PageSpeed score means better rankings.” PageSpeed Insights scores are a diagnostic tool, not a ranking metric. Google uses field data from real users, not lab scores. A page with a 65 lab score but fast field data will outperform a page with a 95 lab score and slow field data. Fix your field metrics; the lab score is a means to that end.
“My site is fast enough — my competitors are slower.” Speed is not relative in Google’s ranking system. Google evaluates your page’s speed against absolute thresholds (the CWV good/needs improvement/poor tiers). Being faster than your competitors still hurts you if your absolute performance is in the “poor” range.
“Optimizing for speed hurts design.” This is the most persistent myth in the industry. Large images, elaborate animations, heavy custom fonts, and complex layouts can all be delivered efficiently with the right technical implementation. Performance is a design discipline, not a constraint on aesthetics.
“Speed only matters for e-commerce.” Every site with goals — lead generation, content consumption, brand building — benefits from speed. Editorial sites see higher page-per-session rates on fast sites. SaaS companies see better trial conversion rates. Non-profits see higher donation completion rates. Speed affects every digital goal.
A Prioritized Action Plan
If you’re starting from scratch, here’s the sequence that delivers the most SEO impact for the effort:
First, fix your server. Upgrade hosting if your TTFB exceeds 1 second. Implement server-side caching. Set up a CDN.
Second, optimize your LCP element. Find your LCP element using PageSpeed Insights or Chrome DevTools. If it’s an image, compress it, convert it to WebP, add width/height attributes, and preload it. This single fix often moves LCP from poor to good.
Third, audit and defer third-party scripts. Use the Coverage tab in Chrome DevTools to identify what’s blocking the main thread. Move non-critical scripts to load after page interaction.
Fourth, fix CLS. Add explicit dimensions to all images and media. Audit for dynamically injected content above the fold.
Fifth, set up monitoring. Use Google Search Console’s CWV report and a synthetic monitoring tool to catch regressions automatically.
Then, iterate. Page speed is a practice, not a project. Monthly audits, quarterly third-party script reviews, and performance budgets in your deployment pipeline keep you fast as your site evolves.
Final Thoughts
Page speed optimization for SEO is one of the few technical disciplines where the interests of search engines, users, and businesses are genuinely aligned. A faster page ranks better, converts better, and is more pleasant to use. The investment pays off across every dimension of digital performance.
The challenge is that speed optimization is genuinely technical, politically complicated (try telling the marketing team their chat widget is hurting rankings), and requires ongoing attention. But the sites that treat performance as a product requirement — not an afterthought — consistently outperform those that don’t, both in search and in every downstream business metric.
Start with your Core Web Vitals field data. Fix the biggest problems first. Monitor relentlessly. That’s it. Everything else is details.